Dispersion Trading in Practice: The “Dirty” Version
Apr 21, 2026 - Tribhuven Bisen
Dispersion trading only generates real P&L when you move beyond the clean academic framework and account for the execution costs, funding drag, gamma mismatches, and flow asymmetries that define the dirty, real-world version of the trade.
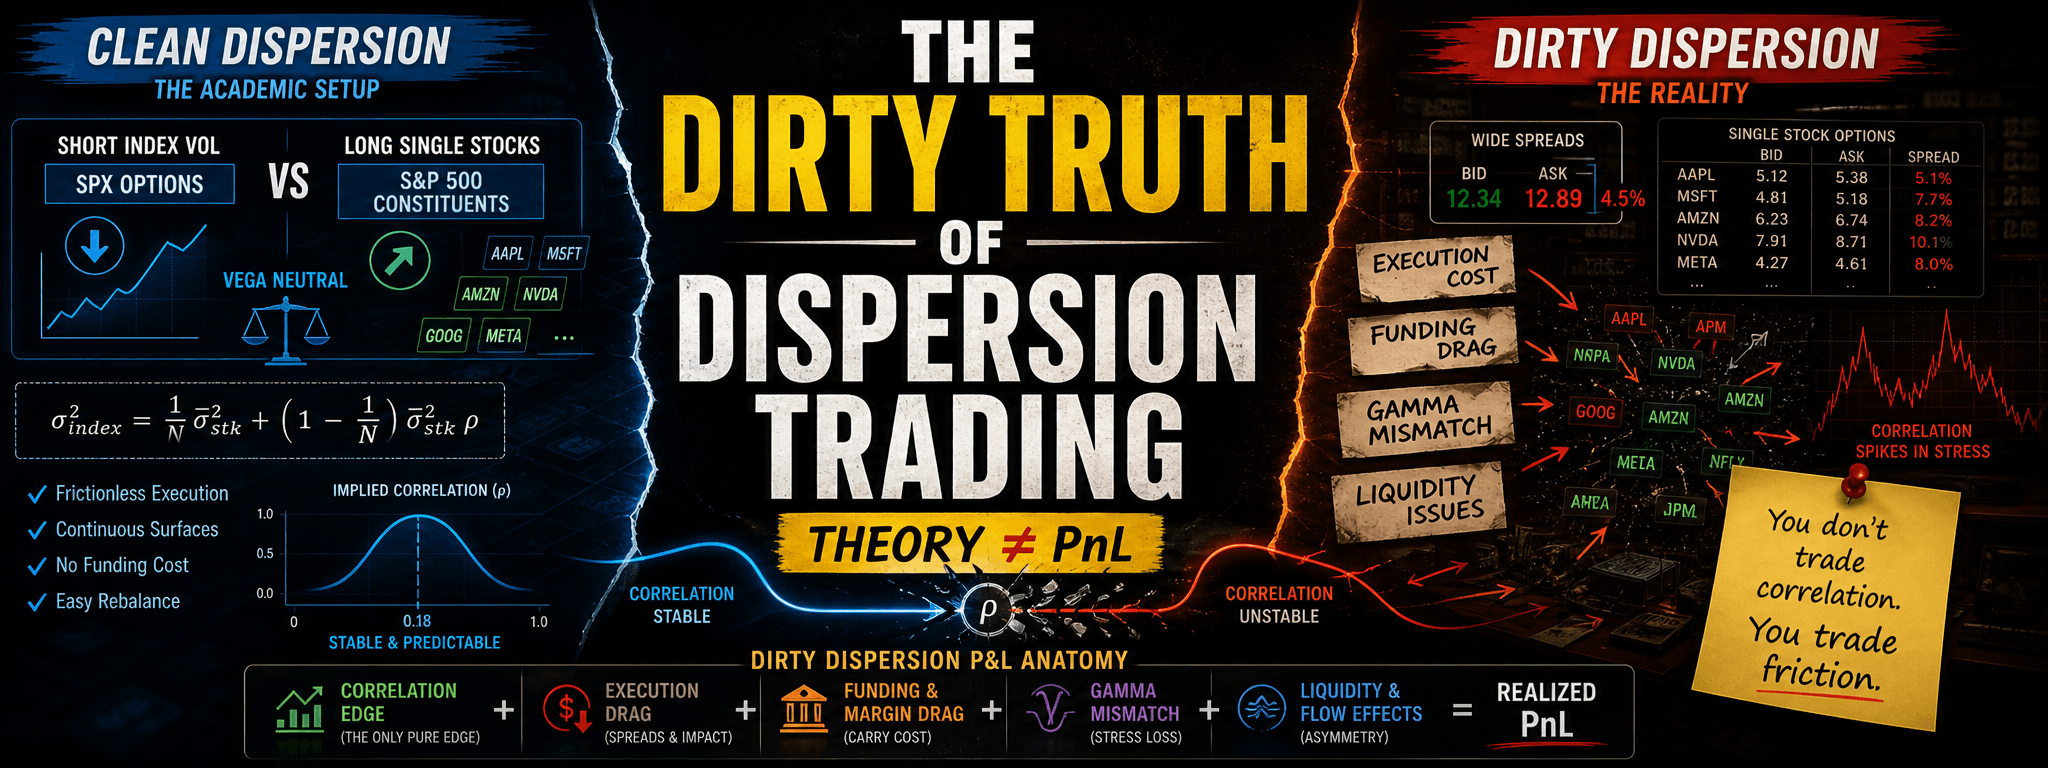
Everyone loves the textbook dispersion trade: short index vol, long single stocks, vega-neutral. But the people who actually make money run the dirty version. Here's why theory dies in backtests and practice wins in P&L.
 Source: Quant Insider
1. Idea
In theory, dispersion trading isolates the correlation risk embedded in index options. The clean (academic) setup can be described as follows:
- Short index volatility (e.g., SPX options).
- Long component stock volatility (options on the S&P 500 constituents).
- Positions are sized to be vega-neutral across both legs, ensuring that the portfolio's exposure to the overall volatility level cancels out.
Formally, for an equal-weighted index of N stocks:
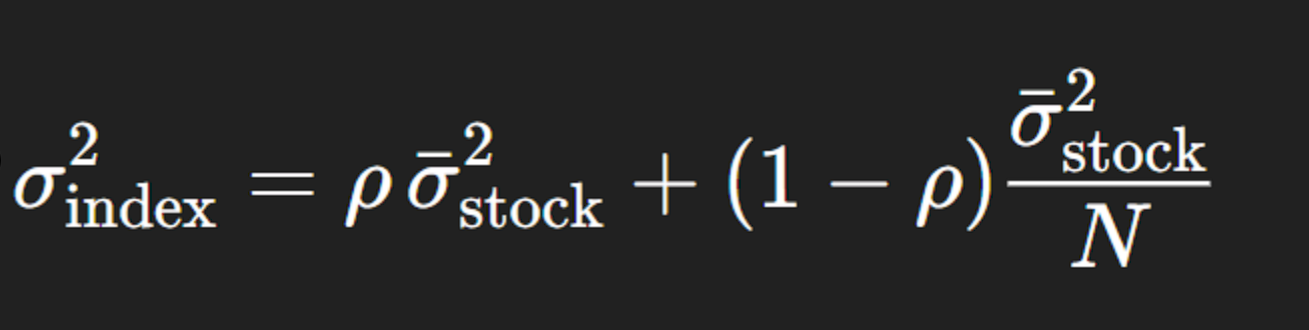
A dispersion trader is effectively short ρ (rho). If realized correlation falls (i.e., stocks move more idiosyncratically), the portfolio's P&L rises; if correlations spike (i.e., during a systemic move), losses occur.
In this idealized world:
- Execution is frictionless.
- Volatility surfaces are continuous and arbitrage-free.
- Positions can be dynamically rebalanced without slippage.
- Funding and margin costs are ignored.
That's the clean math.
2. The Reality: Dirty Dispersion
Real dispersion books don't isolate correlation perfectly because practical constraints dominate:
a. Execution Friction: You're not trading one "index" vs. one "basket." You're trading 500 single names, each with its own bid-ask, greeks, and volatility skew. The moment you cross those spreads, your edge is gone. The theoretical 1–2 vol point edge in implied correlation can vanish in execution cost.
b. Vega Weighting vs. Gamma Risk: In practice, traders size on vega notionals (matching exposure per 1 vol point move). But correlation shocks hit through gamma, not vega. So a "vega-neutral" book isn't truly correlation-neutral during stress — when index gamma explodes.
c. Funding & Margin: Index short legs free margin, but long single-stock options require collateralized margin. Funding spreads compress your realized edge — dirty dispersion must include carry cost and financing P&L. Market makers and vol-arb funds typically finance these through repo or securities lending desks, adding another layer of slippage.
d. Liquidity Asymmetry: Index options are deep and liquid — single-stock options aren't. The skew and term-structure shapes differ widely across names. When we say "dirty," we are talking about the impossibility of finding true parallel strikes and maturities across hundreds of single names. Each stock has unique idiosyncratic volatility smiles, dividend assumptions, and borrow rates.
3. Dirty ≠ Bad — It's the Business
The "dirtness" is not a bug — it's the trade. Prop firms (e.g., SIG, Citadel, Jane Street, Optiver) run their own versions of dispersion trading:
- Sometimes they hedge correlation exposure (long correlation during panic, short correlation during calm).
- Sometimes they run semi-static books with selective hedging.
- Others overlay dispersion on top of market-making inventory to offset skew risk.
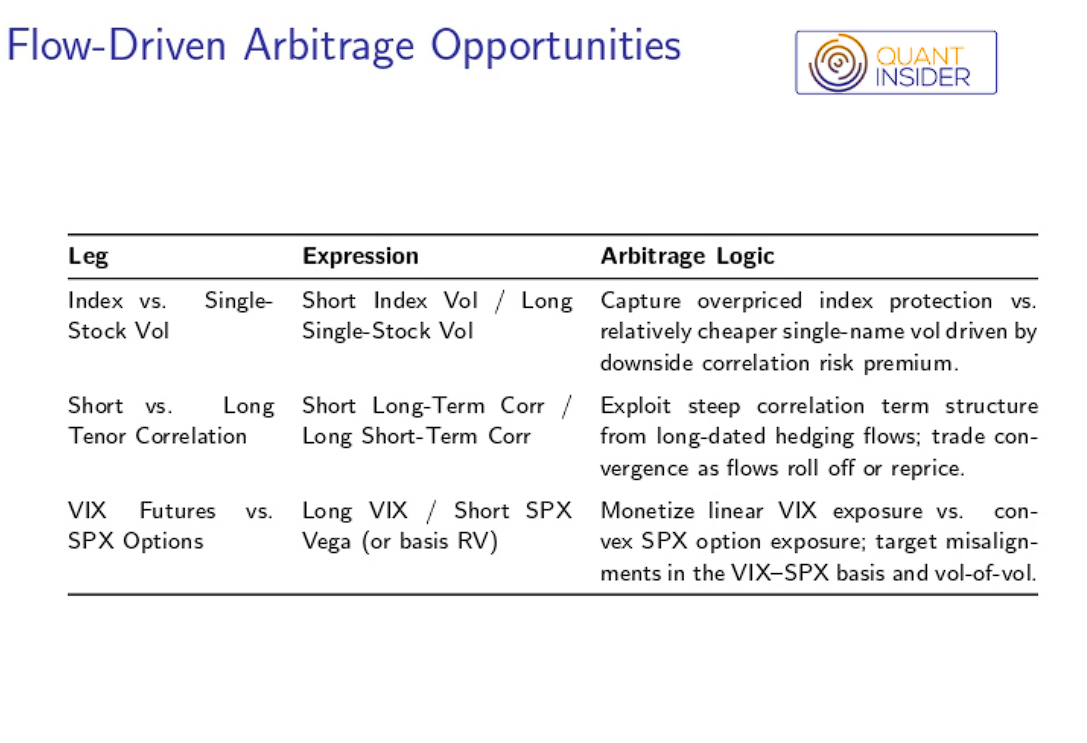
It's not as simple as selling SPX volatility and buying the 500 constituent stocks. The real considerations are about market flows and why they exist. That's where the true alpha lies — the edge isn't in the math, it's in flow asymmetry:
- Dealers and hedgers are often forced sellers of correlation (e.g., through index puts).
- Vol-arb desks act as natural buyers, providing liquidity in the opposite direction.
4. Dirty Dispersion P&L Anatomy
Here's how real P&L attribution typically decomposes:
In clean dispersion, only the first term should exist. In dirty dispersion, the other four dominate your realized outcome.
Practical Example: Setup (S&P-style, Equal-Weighted Intuition)
- Index implied vol: 12%
- Average single-stock implied vol: 28%
- Implied correlation (toy identity under equal vols/weights):

Ex post reality:
- Realized correlation comes in at 0.12 (reflecting idiosyncratic movements, earnings dispersion).
- Assume the average single-stock volatility realizes near what was paid (for simplicity): σ̄stk ≈ 28%.
- What that implies for the index leg: Implied index variance from the identity:

-
Variance gap captured by a short-index / long-basket stance (directionally):
ΔVar ≈ 0.01444 − 0.00941 = 0.00503 (vol² points).
-
Sanity check by square-rooting: implied index vol ≈ 12.0%, realized ≈ 9.7%.
-
In theory, short index vol versus long single-stock vol benefits as correlation drops (0.184 → 0.12).
-
This represents the textbook "short-correlation" payoff.
Now the Dirty Part (Where Edge Dies If You're Sloppy)
Execution drag (basket reality): You don't cross one spread, you cross a basket. Suppose you trade the top 200 names, and your average all-in spread toll works out to 1.5 bps per name (vega-weighted, in P&L terms relative to index notional). Toll ≈ 200 × 1.5 bps = 300 bps — that's 3% of index-notional P&L equivalent on the round-trip. If your variance edge translates to only a few percent-of-vega across the life, 300 bps can nuke it.
Funding / carry: Long single-name options consume margin; index shorts free less than you think. Add ~50–100 bps/yr funding drag (repo, margin, borrow frictions). On a 3–6M trade horizon, knock off another 15–50 bps.
Surface mismatch (residual vega/gamma): Your "vega-neutral" sizing doesn't immunize gamma in a stress or skew curvature when names gap differently. Expect mark-to-market noise that can easily rival your theoretical correlation edge unless you rebalance ruthlessly — which costs more spread.
Clean math edge: Correlation drop from 0.184 → 0.12 gives you a 0.0050 vol² variance advantage (12.0% → 9.7% implied-to-realized on the index leg, holding stock vols steady).
Dirty reality: 300 bps basket crossing + carry/funding 15–50 bps + mismatch/gamma noise can fully offset that advantage unless you:
- Restrict the basket (liquid names, tighter quotes),
- Time entries around known flow,
- Size on vega-notional but monitor gamma, and
- Automate rebalance logic to minimize churn.
You can't arbitrage correlation cleanly; you can only exploit flow imbalances when:
- The index vol is bid (systematic put demand),
- The single-stock vol is stale or under-reactive, and
- Your execution infrastructure can recycle the risk faster than it decays.
The "dirty" in dirty dispersion is the alpha.
Visualizations
1 Correlation Term Structure: Theoretical vs Observed
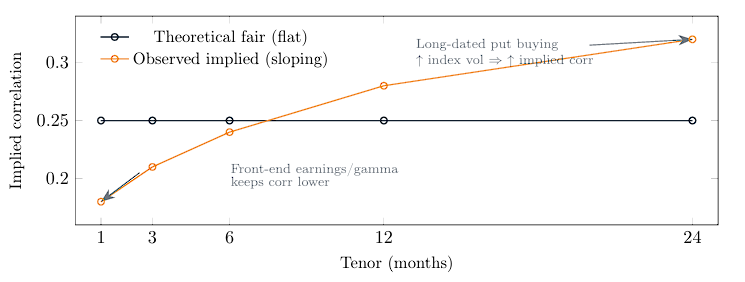
Figure 1: Flows bend the correlation curve. Long-end hedging demand lifts index vol relative to single stocks, raising long-tenor implied correlation.
Source: Quant Insider
2 "Pure" vs "Dirty" Dispersion: P&L Anatomy
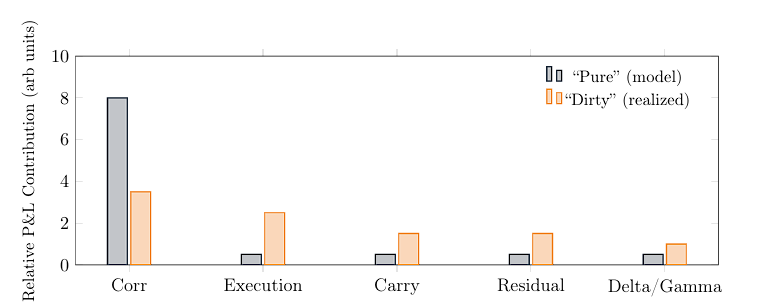
Figure 2: The model says "short correlation earns carry"; the desk says "only if it survives execution, funding, and curvature mis-matches."
Source: Quant Insider
3 Execution Friction Schematic (Optional)
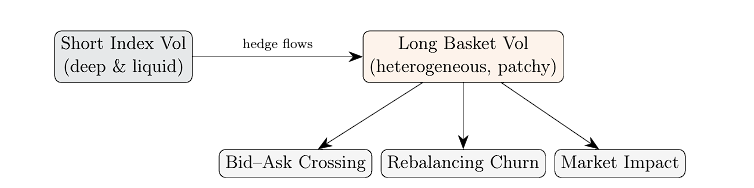
Figure 3: Execution frictions multiply across a large basket: you do not cross one spread, you cross hundreds.
Source: Quant Insider
Conclusion
- "Pure" dispersion is didactic: vega-neutral, correlation-isolated, frictionless.
- Real P&L comes from dirty dispersion: flow-aware, execution-aware, funding-aware.
- You do not arbitrage correlation cleanly; you harvest correlation premia when index vol is flow-distorted, single-stock vol is slow, and your infrastructure recycles risk faster than costs erode it.