Why Skew at 1st Percentile Doesn't Mean Buy It
Jun 09, 2026 - Tribhuven Bisen
A low skew percentile is not a buy signal. In efficient markets, low implied skew often reflects expectations for low realized skew, and the missing context is usually flow, carry, and why the surface is shaped that way.

Why "Skew at 1st Percentile" Doesn't Mean Buy It
One of the most seductive traps in volatility markets is simple: you pull up skew, see it at the 1st percentile of its historical range, and assume you have found a trade. Cheap is cheap, right? Buy it low, sell it high.
That logic is tempting, but it is too thin. The naive version says: if skew is high, sell it; if skew is low, buy it. Traders often apply the same shortcut to implied volatility and correlation. But a percentile is only a description of where today's number sits versus history. It is not proof that the market made a mistake.
The uncomfortable fact is that the market is usually fairly efficient. If implied skew is low, it is often low because realized skew is expected to be low. If implied skew is high, it is often high because realized skew is expected to be high. The percentile is not automatically identifying a dislocation. It may simply be showing that the market is pricing an extreme set of conditions.
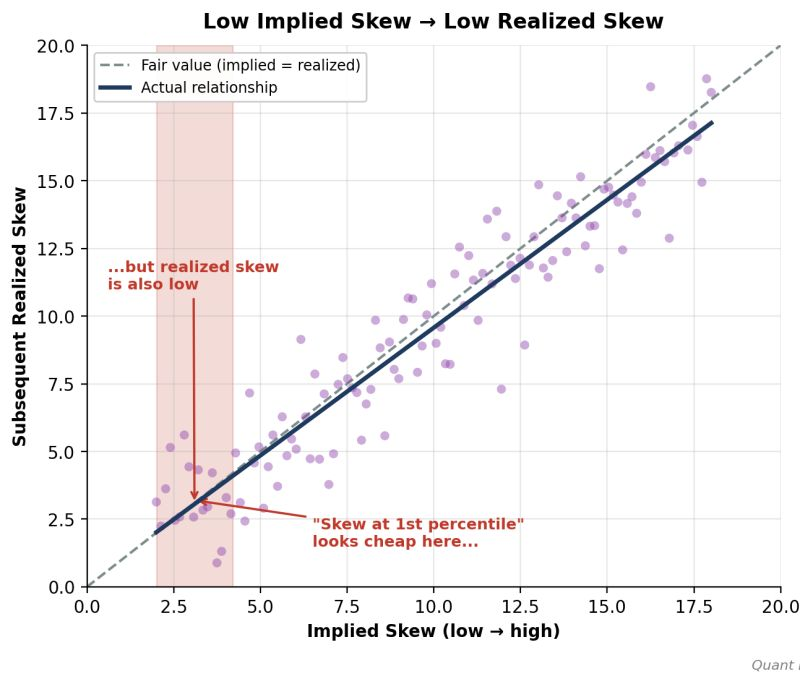
Low implied skew can look cheap in percentile terms, but the subsequent realized skew can also be low. The trade is not cheap unless realized behavior beats what the surface already implies.
You need more insight than "it is low" to have a good trade. The percentile alone is not an insight.
The Stock Price Analogy
The flaw is easier to see in a simpler setting. Suppose a stock trades at a low dollar price. Should you buy it because it is low and sell it when it is high? Obviously not. A 400 stock is not automatically expensive. Price level alone tells you almost nothing about valuation, expected return, or risk.
Skew percentile is similar. A 1st-percentile reading is a descriptive number. It is not a buy signal any more than a low stock price is a buy signal.
Why Mean Reversion Fails Here
Percentile-based skew trading is usually mean reversion thinking dressed up as quantitative discipline. The hidden assumption is: this number is far from its average, therefore it should revert, therefore I should get paid to bet on that reversion.
But in volatility markets, the object being measured is itself a forecast. Low skew is the market's forecast that realized skew will be low. The market is not necessarily sitting at an extreme because it forgot to normalize. It may be sitting there because the conditions that produce low realized skew are present right now.
There is also a second problem: carry. Even when skew screens cheap, the position can cost money to hold. You can be right that skew is historically low and still bleed while waiting for a reversion that the market never owed you.
So the percentile trade has two problems at once:
- The signal may not be a real signal.
- The position may have negative carry while you wait.
What Skew Actually Tells You
Skew does not directly tell you the direction of the stock market. More precisely, skew tells you how implied volatility is expected to move as spot moves.
A steep equity-style put skew implies that implied volatility should rise a lot when the market falls and fall when the market rallies. A flatter curve, or even an upward-sloping curve in a meme-stock regime, implies that implied volatility may not rise much on downside moves, or may even get bid as spot rallies because upside call demand dominates.
That is why the skew curve is often more efficient than a percentile screen makes it look. A low skew reading usually has a reason rooted in expected realized behavior or flow. It is not automatically evidence that the surface is wrong.
How Real Dislocations Are Found
None of this means skew is never tradable. It means the trade is not found by staring at a percentile.
A real dislocation usually needs context. Most often, that context is flow: who is buying, who is selling, where they are concentrated on the surface, and whether their activity is pushing one part of the surface away from fair compensation.
Take a concrete example. Suppose large call overwriting programs from yield-oriented ETFs are active in a name like Nvidia, selling large size in one-month upside calls. If you know that flow exists, you can look at the surface differently. You can compare front-end upside skew versus the back end, ask whether the front is being mechanically depressed, and then think about what trade expresses that view.
That is a very different process from saying, "skew is at the 1st percentile, so buy it." The flow gives you a reason to believe price may be dislocated. The percentile only tells you the number is far from its own history.
The Better Questions
First-order thinking creates most misconceptions in this space:
- "Skew is at the 90th percentile, sell it."
- "Skew is at the 10th percentile, buy it."
- "It is historically extreme, so it must revert."
Markets are usually not that inefficient. If you want to trade skew, the better questions are:
- What flow is driving skew here?
- Is the surface compensating me enough to take the other side?
- What realized behavior is the market already pricing?
- What is the carry while I wait?
- What structure lets me isolate the dislocation rather than just own a percentile?
Answer those, and you may have a trade. Skip them and lean only on the percentile, and you have probably talked yourself into a position the market was happy to give you.